Here is an example of how to get this going. I’ve taken some of @Chadodesu’s steps but added some images to the mix. The mechanism only works for WingBits. So if you have the WB200 or MGW310, this will work. This assumes you have Home Assistant installed, your WingBits is connected to the network and can communicate with Home Assistant.
Add Wingbits Data to Home Assistant
Log into your Home Assistant environment
Add HACS to Home Assistant
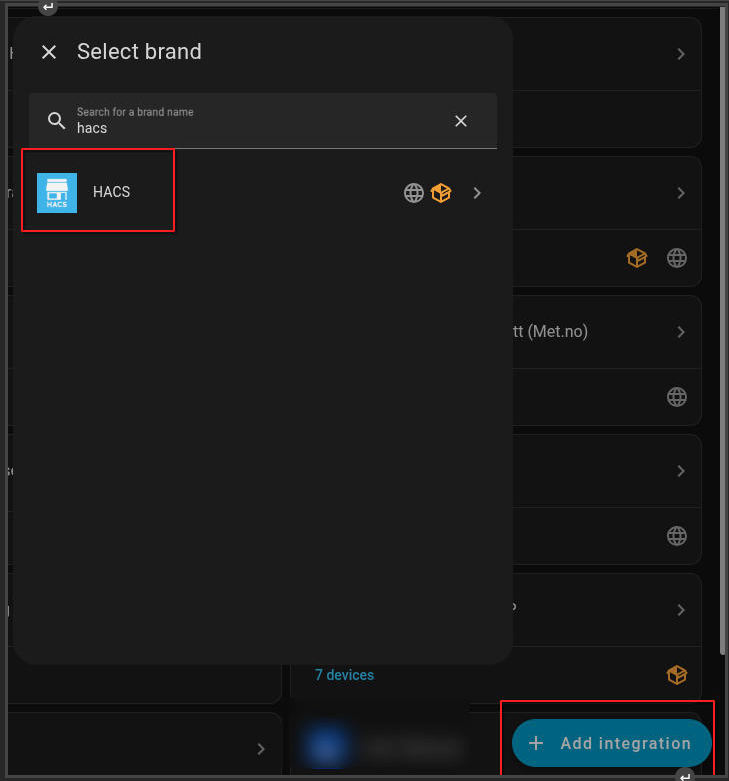
In Settings → Devices and Services. Click Add Integration
Search for HACS
Install the Service
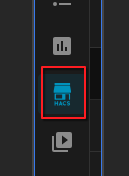
Go to the HACS section from the left menu
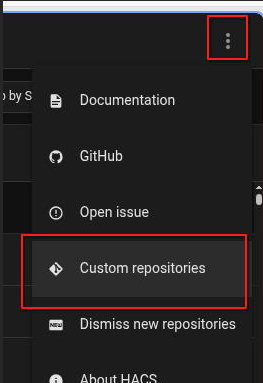
At the top right, click the three dots and custom repositories
In the custom repositories section, provide the GitHub Repo link https://github.com/SmartBoatInnovations/ha-smart0183tcp and select the Integration Type.
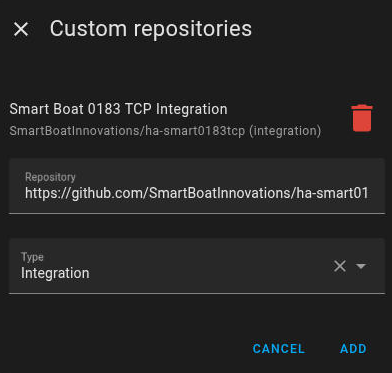
Click Download, at the bottom right, install and reboot your HA
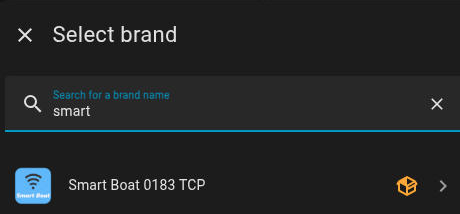
In the Settings section, click Add Integration and look for Smart Boat 0183 TCP. Click Add
Setup your Wingbits unit, ensure that you have Graphs Enabled in the Wingbit's WebUI
Add in your Wingbits IP address, provide a name and use the port: 15160
Add or edit a custom dashboard
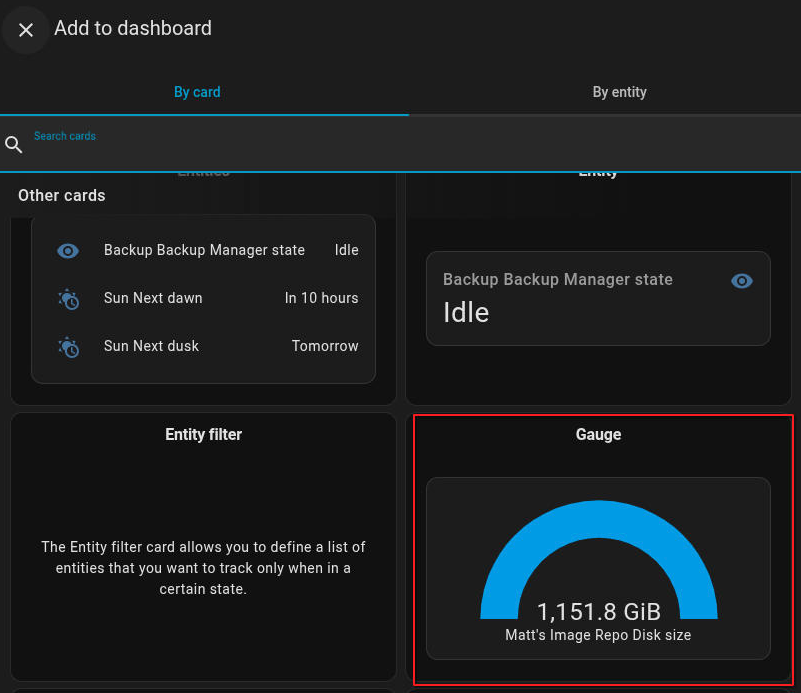
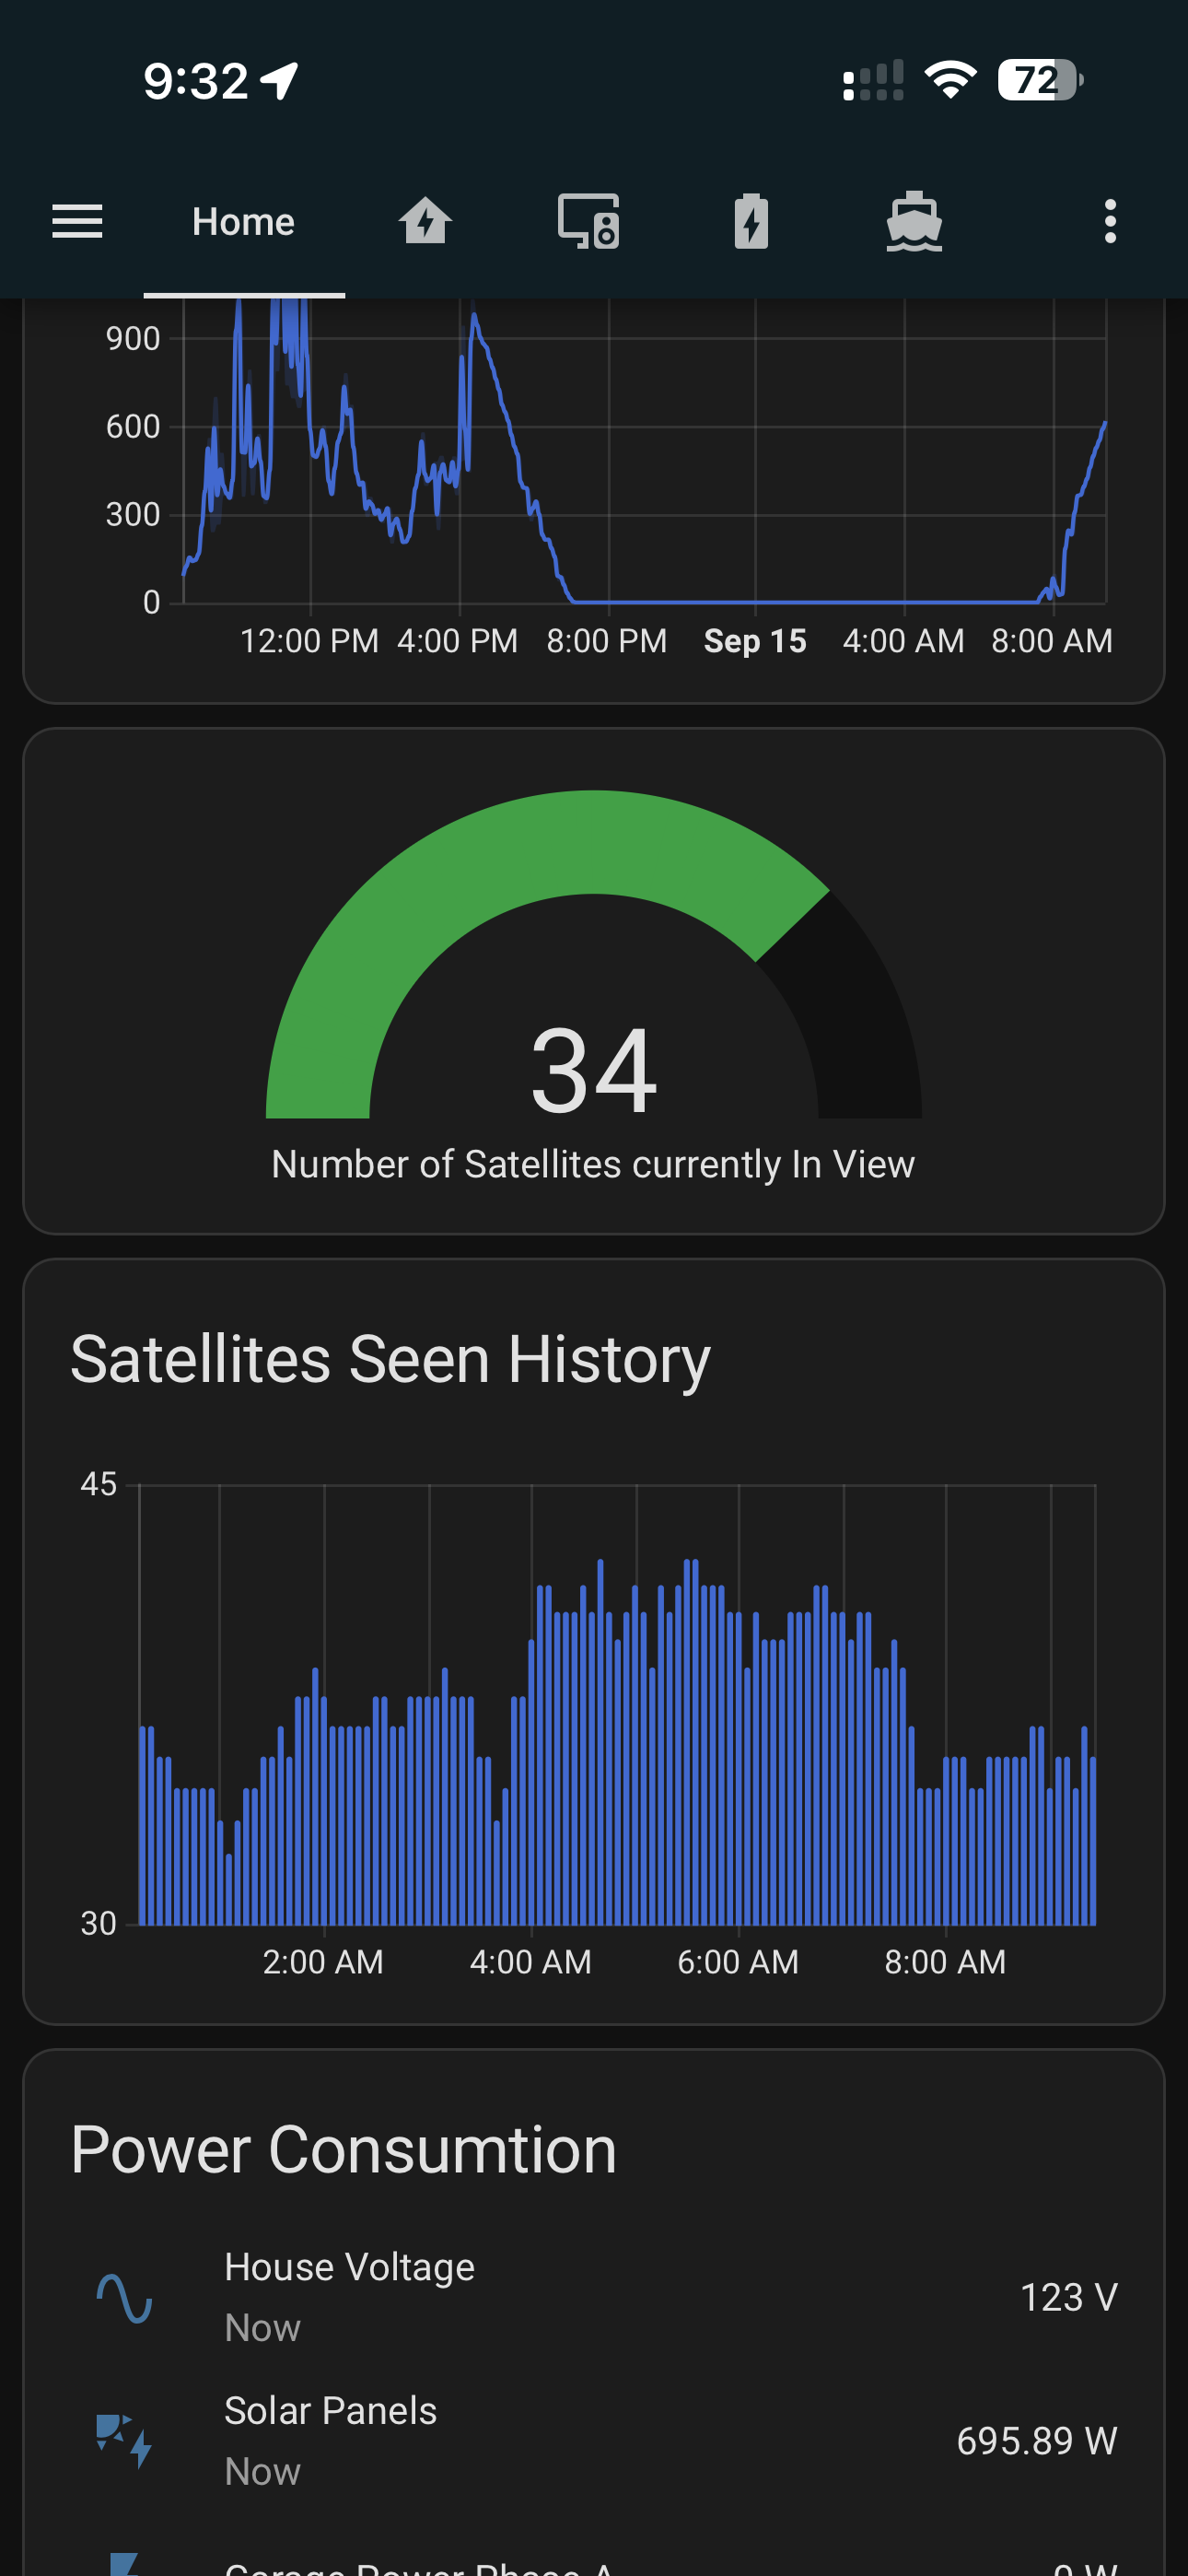
Add a Gauge card
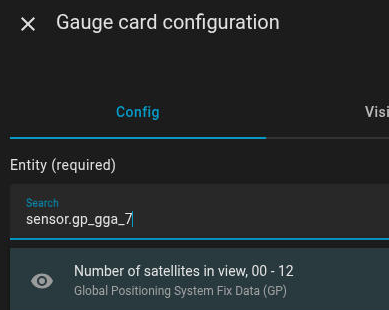
Search for the entity: sensor.gp_gga_7
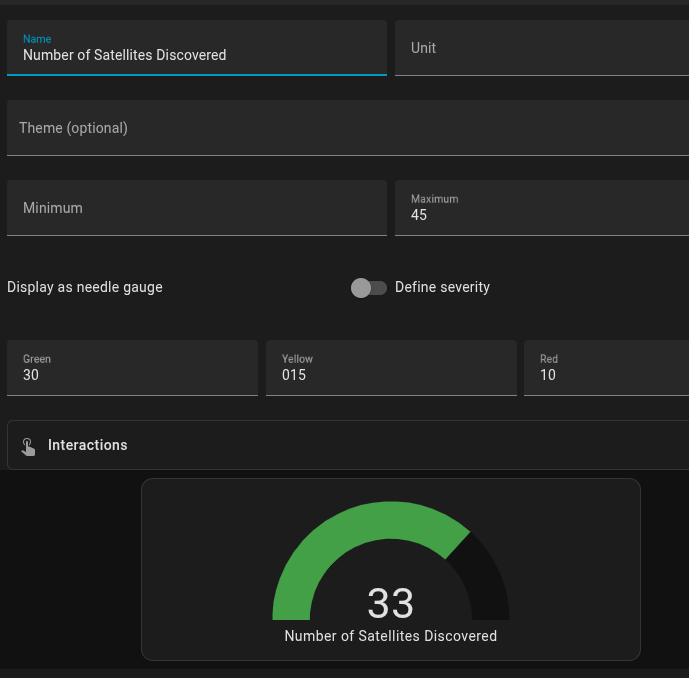
Define a name for your Gauge
Define the Severity levels
Set the Max to 45
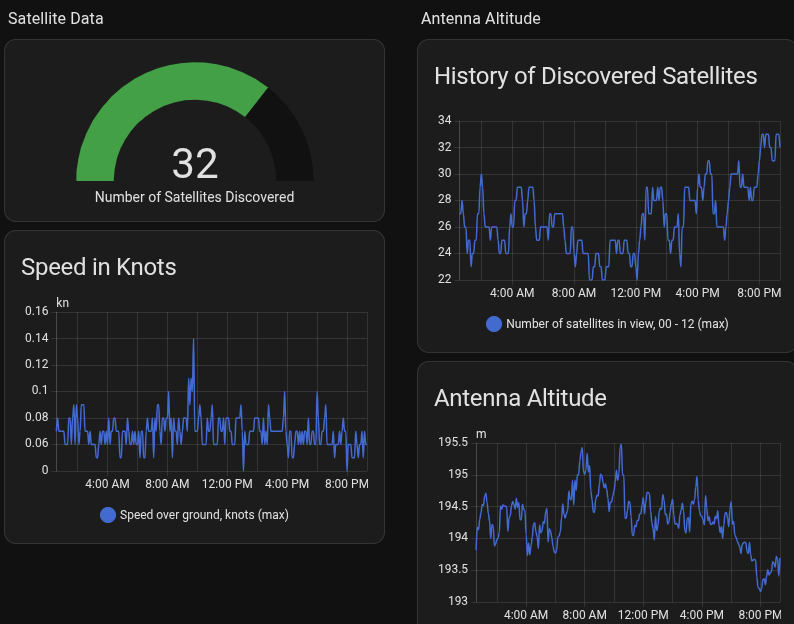
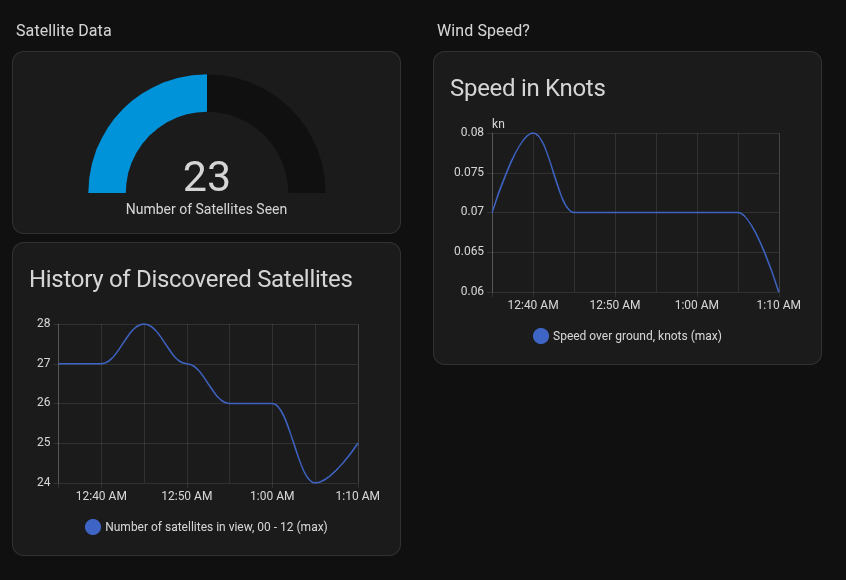
Below is an example
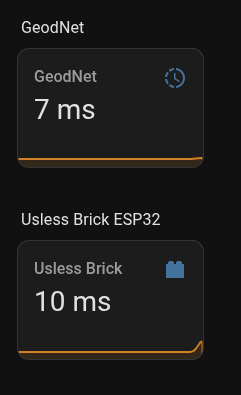
With other modifications, you can display other data tiles.
Nice!